This week I needed database (RDBMS) and PHP (frameworks) benchmarks for the Scaleway C2M server. Whilst doing so, I thought it would be useful to fully benchmark the server and share it in a blogpost.
CPU & Memory
I tested the dedicated server (C2M) with 8 cores, 16GB ram and 50GB storage (running Ubuntu 16). At the time of writing, this server costs 17,99 euro/month.
This baremetal box runs an Intel Atom C2750 processor clocked at 2.4GHz
Geekbench
Geekbench 4 scores:
| Single-Core Score | Multi-Core Score |
|---|---|
| 1187 | 6031 |
De detailed Geekbench result can be found here: Scaleway C2M
SysBench
Multi-Core SysBench CPU benchmark:
Test execution summary:
    total time:                          5.7415s
    total number of events:              10000
    total time taken by event execution: 45.8982
    per-request statistics:
        min:                                  4.59ms
        avg:                                  4.59ms
        max:                                 10.45ms
        approx.  95 percentile:               4.59ms

Threads fairness:
    events (avg/stddev):           1250.0000/1.12
    execution time (avg/stddev):   5.7373/0.00
MySQL database performance
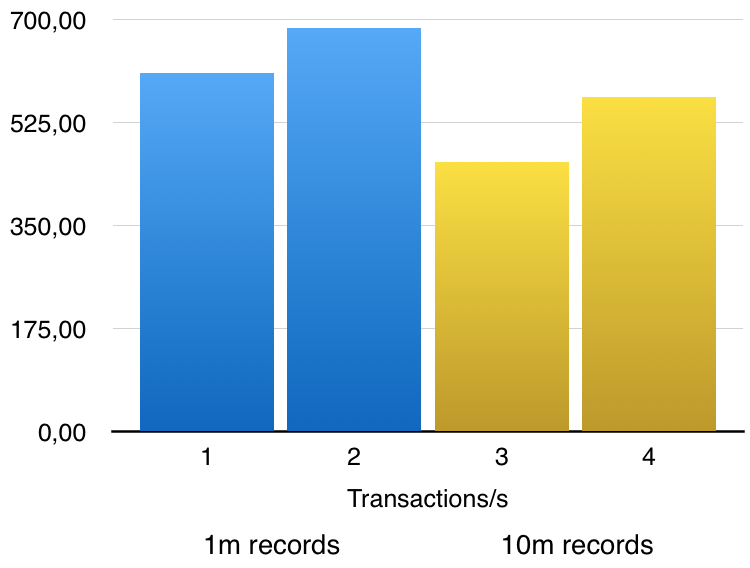
MySQL performance benchmarks using SysBench on a test database with respectively 1M and 10M records:
| MySQL Benchmark | Transactions | Transactions/s | Records | Time (s) |
|---|---|---|---|---|
| 1 | 36528 | 608,73 | 1000000 | 60,0072 |
| 2 | 41212 | 686,29 | 1000000 | 60,0500 |
| 3 | 27503 | 458,34 | 10000000 | 60,0054 |
| 4 | 34156 | 569,19 | 10000000 | 60,0078 |
PHP frameworks performance
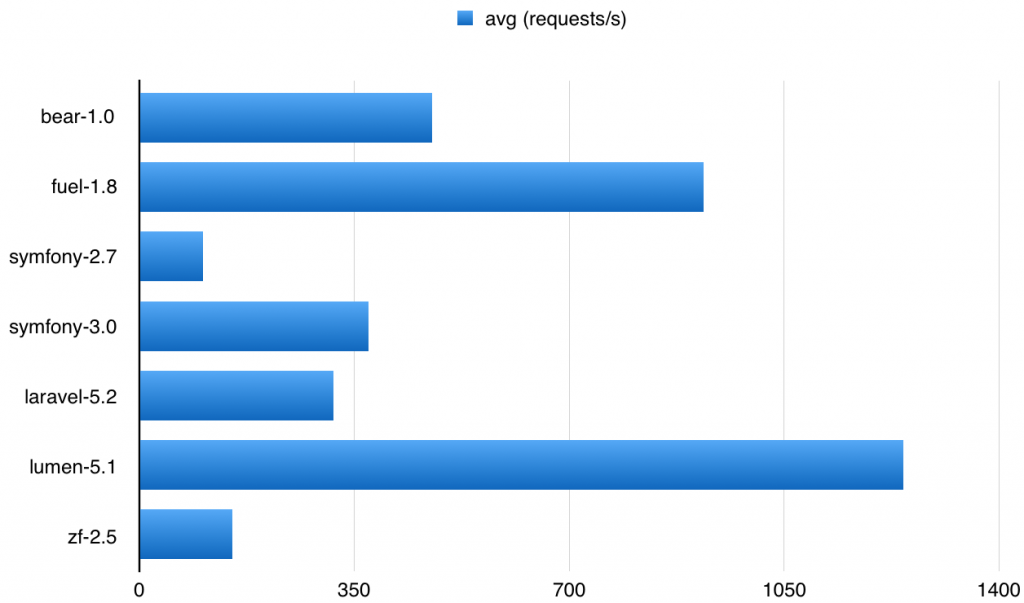
PHP requests per seconds using Apache 2 and a simple controller in the given framework (using PHP Framework Benchmark):
| Benchmark (requests/s) |
bear-1.0 | fuel-1.8 | symfony-2.7 | symfony-3.0 | laravel-5.2 | lumen-5.1 | zf-2.5 |
|---|---|---|---|---|---|---|---|
| 1 | 350,27 | 889,72 | 39,57 | 356,89 | 294,87 | 1239,55 | 143,75 |
| 2 | 512,64 | 926,63 | 125,72 | 373,66 | 321,85 | 1246,79 | 154,66 |
| 3 | 472,75 | 932,44 | 124,33 | 381,75 | 326,33 | 1233,77 | 155,71 |
| 4 | 569,57 | 927,51 | 124,47 | 380,31 | 321,88 | 1254,69 | 153,92 |
| avg | 476,3075 | 919,075 | 103,5225 | 373,1525 | 316,2325 | 1243,7 | 152,01 |
Network speed
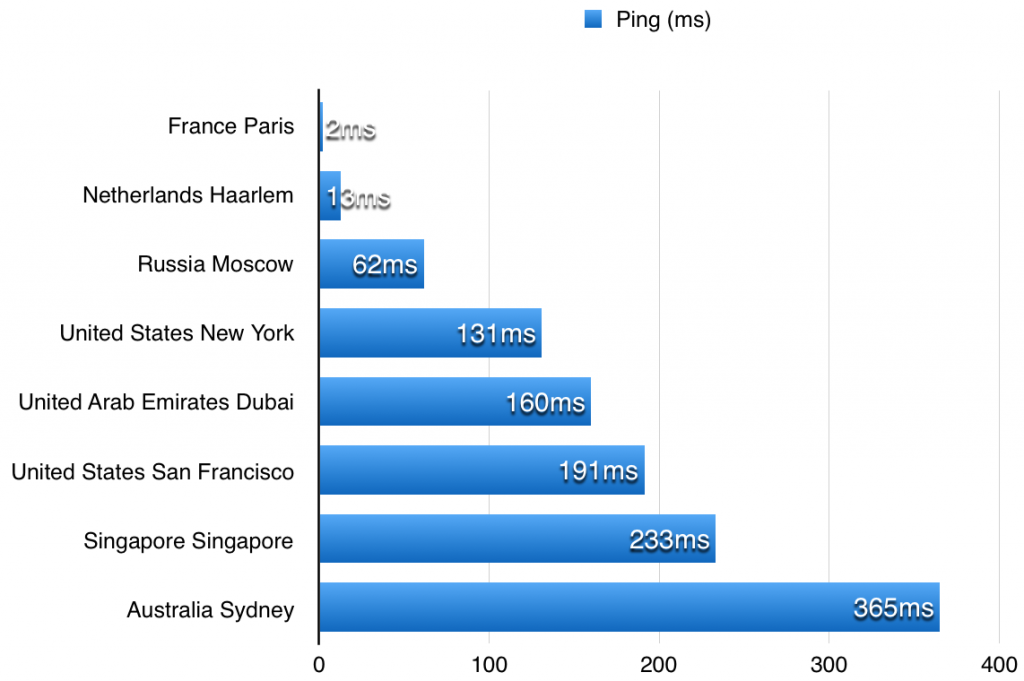
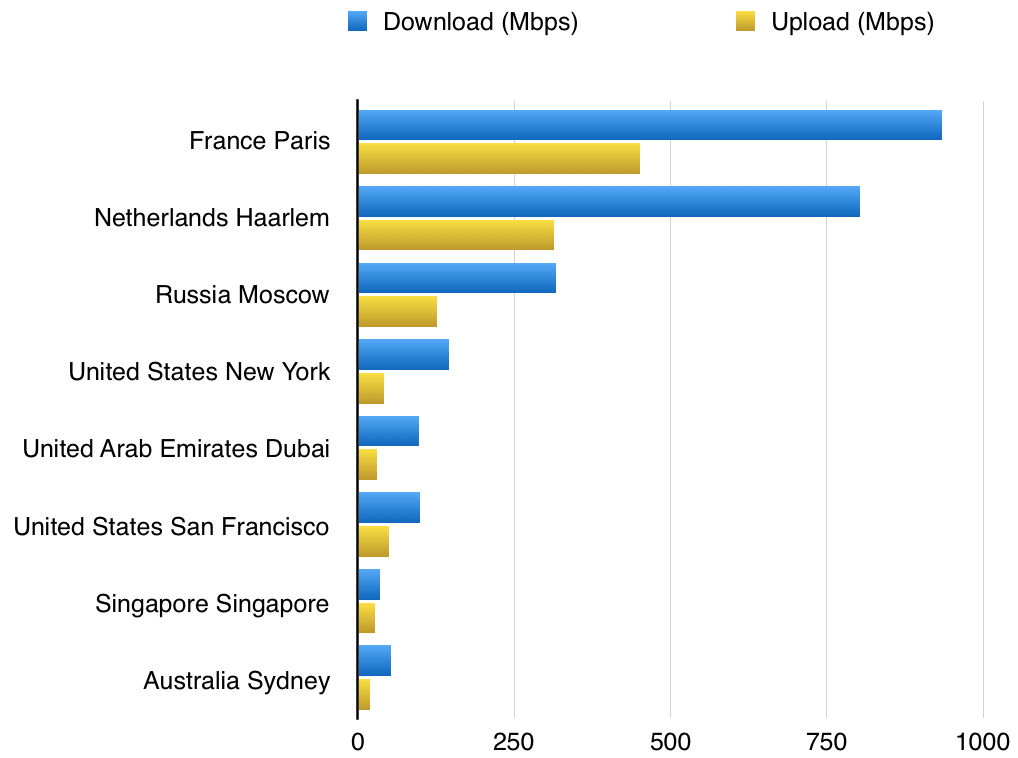
Network speed tested with Speedtest.net to different locations around the world:
| Speedtest | Ping (ms) | Download (Mbps) | Upload (Mbps) | Distance (Km) | |
|---|---|---|---|---|---|
| France | Paris | 2,126 | 933,77 | 450,86 | 1,88 |
| Netherlands | Haarlem | 12,643 | 803,83 | 313,28 | 423,92 |
| Russia | Moscow | 61,75 | 316,53 | 126,94 | 2487,01 |
| United States | New York | 131,036 | 146,30 | 41,29 | 5836,26 |
| United Arab Emirates | Dubai | 160,098 | 98,37 | 29,97 | 5246,32 |
| United States | San Francisco | 191,342 | 99,96 | 49,63 | 8952,54 |
| Singapore | Singapore | 233,212 | 35,85 | 28,26 | 10732,95 |
| Australia | Sydney | 365,136 | 52,51 | 19,59 | 16960,81 |
Disk
FreeVPS.us benchmark
Disk I/O benchmark with freevps.us:
| # | I/O speed |
|---|---|
| 1 | 106 MB/s |
| 2 | 136 MB/s |
| 3 | 88 MB/s |
| avg | 110 MB/s |
vpsbench
Disk I/O benchmark with vpsbench:
| # | I/O speed |
|---|---|
| 1 | 153 MB/s |
SysBench
Disk I/O benchmark with Sysbench:
Extra file open flags: 0
128 files, 320Mb each
40Gb total file size
Block size 16Kb
Number of random requests for random IO: 0
Read/Write ratio for combined random IO test: 1.50
Periodic FSYNC enabled, calling fsync() each 100 requests.
Calling fsync() at the end of test, Enabled.
Using synchronous I/O mode
Doing random r/w test
Threads started!
Time limit exceeded, exiting...
Done.

Operations performed:  73500 Read, 49000 Write, 156744 Other = 279244 Total
Read 1.1215Gb  Written 765.62Mb  Total transferred 1.8692Gb  (6.3795Mb/sec)
  408.29 Requests/sec executed

Test execution summary:
    total time:                          300.0315s
    total number of events:              122500
    total time taken by event execution: 42.8032
    per-request statistics:
         min:                                  0.00ms
         avg:                                  0.35ms
         max:                                 11.18ms
         approx.  95 percentile:               1.07ms

Threads fairness:
    events (avg/stddev):           122500.0000/0.00
    execution time (avg/stddev):   42.8032/0.00