In one of my previous posts I wrote about plotting LaTeX function graphs using pgfplots. But sometimes you don’t have a function rule, but just a set of data points.
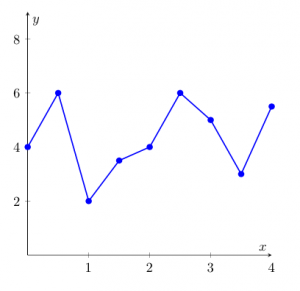
Using pgfplots you can easily plot a function using those coordinates. The following Tex code will draw a line through each of the data points.
\begin{tikzpicture}[>=stealth]

    \begin{axis}[
        height=\textwidth/1.5,
        width=\textwidth/1.5,
        xmin=0,xmax=4,
        ymin=0,ymax=9,
        axis x line=middle,
        axis y line=middle,
        axis line style=->,
        xlabel={$x$},
        ylabel={$y$},
    ]


    % plot some coordinates
    \addplot[mark=*, blue, line width=1pt] coordinates {
        (0,   4)
        (0.5, 6)
        (1,   2)
        (1.5, 3.5)
        (2,   4)
        (2.5, 6)
        (3,   5)
        (3.5, 3)
        (4,   5.5)
       };

   \end{axis}

\end{tikzpicture}
Which will yield the following result:
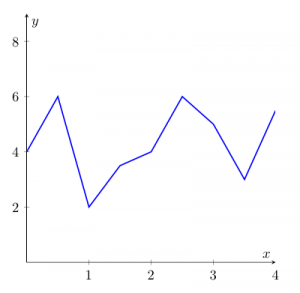
Naturally you can draw a line without printing dots in the points, you just set mark=none.