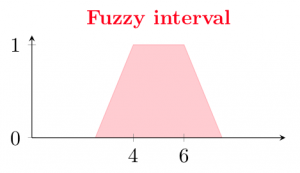
Fuzzy logics (especially fuzzy numbers and fuzzy intervals) can be beautifully plotted on a graph, …. aaaand of course, you can also do this using LaTeX and pgfplots!
\begin{tikzpicture}
        \begin{axis}[
            height=3.5cm,
            width=\textwidth/2,
            ytick={0,1},
            xtick={4,6},
            area style,
            xlabel={$$},
            xmin=0,xmax=10,
            axis x line=bottom,
            axis y line=left,
            %ylabel={$$},
            enlarge x limits=false
            ]

            \addplot[fill, red, opacity=0.2] coordinates
                {(2.5,0)(4,1)(6,1)(7.5,0)}
                \closedcycle;
                \addplot [red, mark = none, nodes near coords=\textbf{Fuzzy interval},every node near coord/.style={anchor=90,rotate=0,anchor=south,align=center}] coordinates {( 5, 1.1)};

        \end{axis}
\end{tikzpicture}